
Incidence and Prevalence
What you'll learn
- EPIDEMIOLOGY AND POPULATION HEALTH: Disease frequency measures -> Distinguish incidence from prevalence
- EPIDEMIOLOGY AND POPULATION HEALTH: Disease frequency measures -> Select the correct denominator and time frame
- BIOSTATISTICS AND EVIDENCE INTERPRETATION: Measure interpretation -> Translate formulas into population meaning
- SCREENING, PREVENTION, AND HEALTH PROMOTION: Program planning -> Use incidence versus prevalence to guide preventive strategy
- INTEGRATED PRACTICE-BASED DECISION-MAKING: Board-style reasoning -> Eliminate common distractors in surveillance and screening stems
- Domain: Epidemiology and population health -> Disease frequency measures -> Incidence, prevalence, denominator logic
- Domain: Biostatistics and evidence interpretation -> Quantitative interpretation -> Measure calculation and interpretation
- Domain: Screening, prevention, and health promotion -> Population risk assessment -> Choosing the right metric for prevention planning
- Domain: Integrated practice-based decision-making -> Best next interpretation -> Match question wording to the correct epidemiologic measure
Why it matters
- Incidence answers a prevention question: How often are new cases occurring? That makes it central to risk estimation, causal inference, and evaluating interventions.
- Prevalence answers a burden question: How much disease exists right now or over a defined interval? That makes it central to service planning, staffing, and resource allocation.
- Board stems often make both answers look plausible by adding distracting chronic disease history, migration, or survival changes; the correct choice depends on whether the stem asks about new occurrence or existing burden.
- Incidence and prevalence are foundational for later topics including attack rates, mortality measures, screening interpretation, outbreak analysis, and surveillance design.
Key Terms & Must-Know Facts
1.1.1.1 Key terms
- Incidence proportion: proportion of initially disease-free people who develop disease during a specified period
- Cumulative incidence: another name for incidence proportion
- Incidence rate: new cases per unit of person-time
- Person-time: total time each participant is at risk and under observation
- Prevalence: proportion of a population with disease
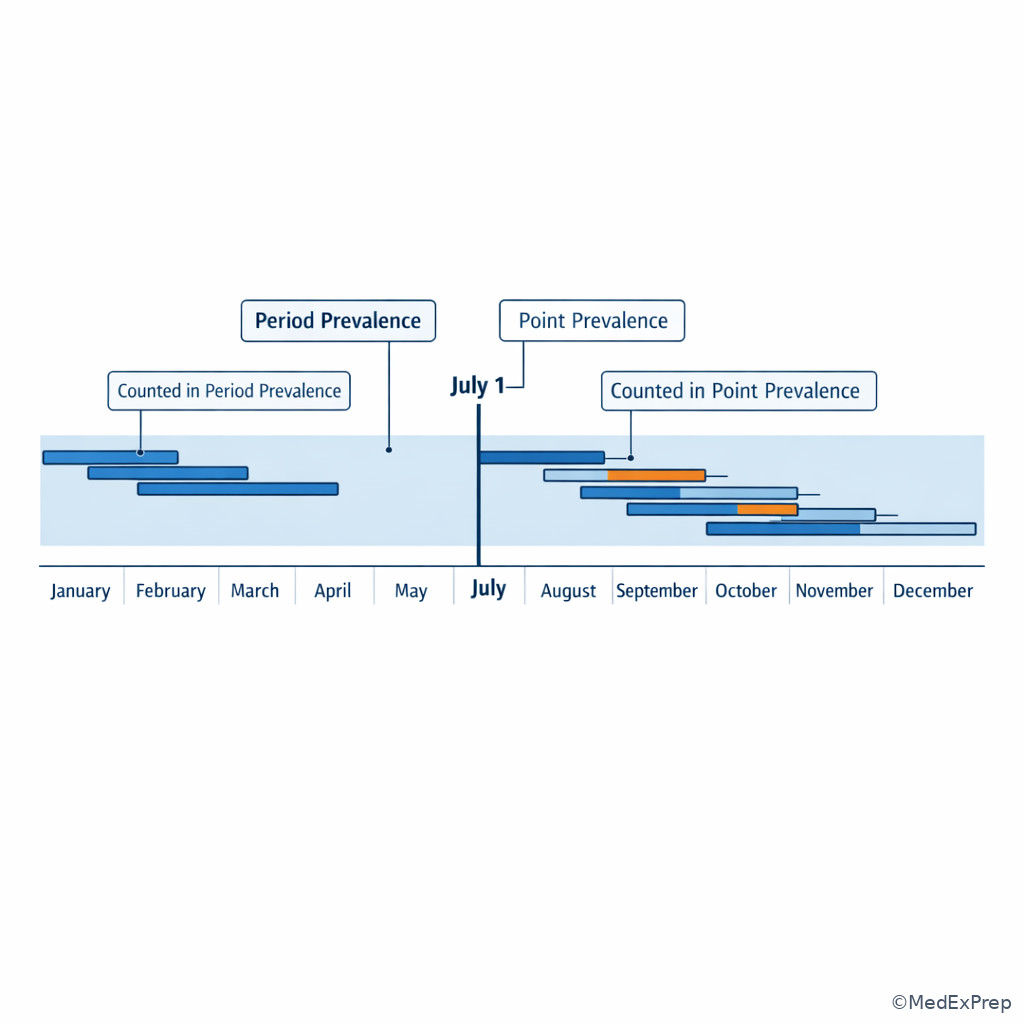
- Point prevalence: existing cases at one point in time
- Period prevalence: people who had disease at any time during a specified interval
- Numerator: count of cases meeting the definition
- Denominator: population at risk corresponding to that numerator
- Population at risk: those capable of developing the condition
- Open population: population with entries and exits over time
- Closed population: fixed membership during follow-up
- Disease duration: time from onset to recovery or death
- Burden of disease: overall amount of disease present in a population
- Risk: probability of new disease occurring over a stated interval
1.1.1.2 Must-know facts
- Incidence uses new cases only; prevalence uses all existing cases.
- Prevalence rises with either higher incidence or longer disease duration.
- A chronic disease can have low incidence but high prevalence.
- A rapidly fatal disease can have high incidence but low prevalence.
- Incidence is the better measure for etiology and risk.
- Prevalence is the better measure for health care needs and planning.
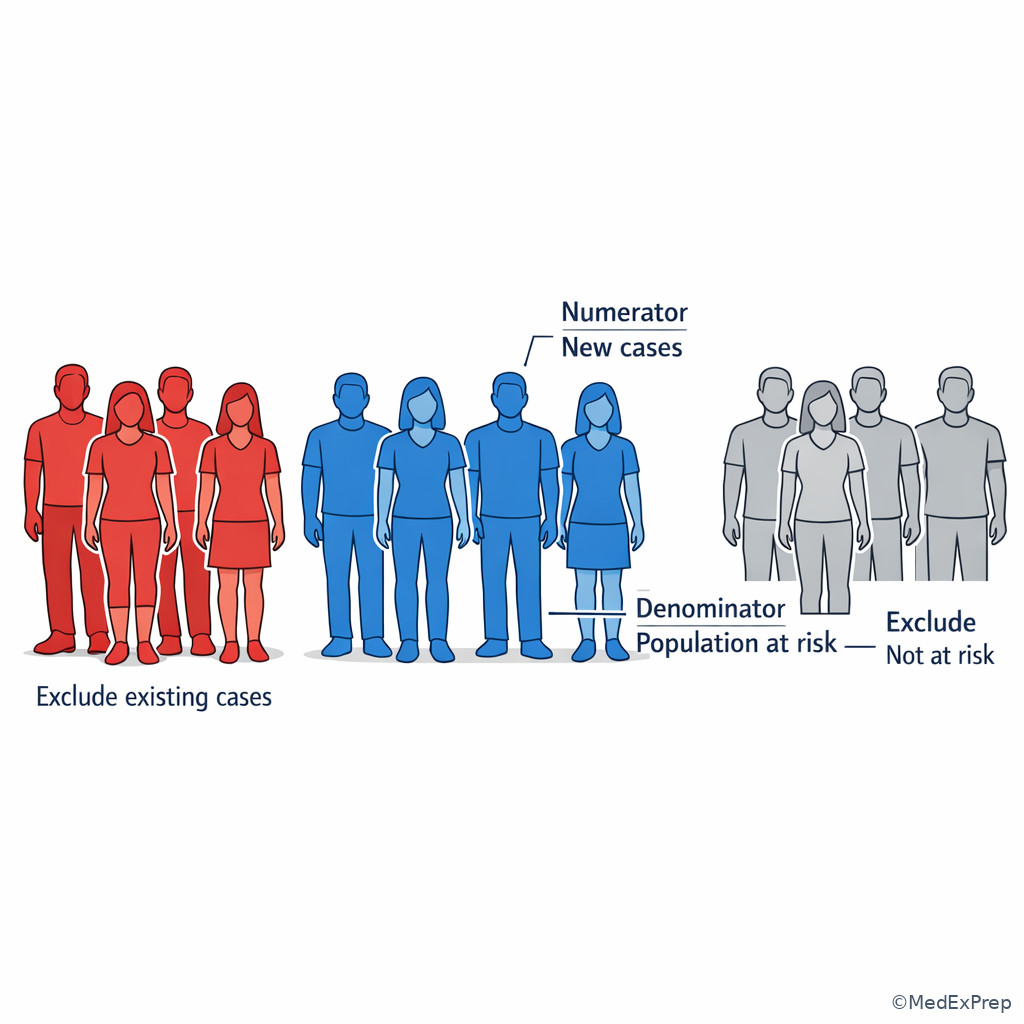
- People already diseased at baseline are excluded from incidence denominators.
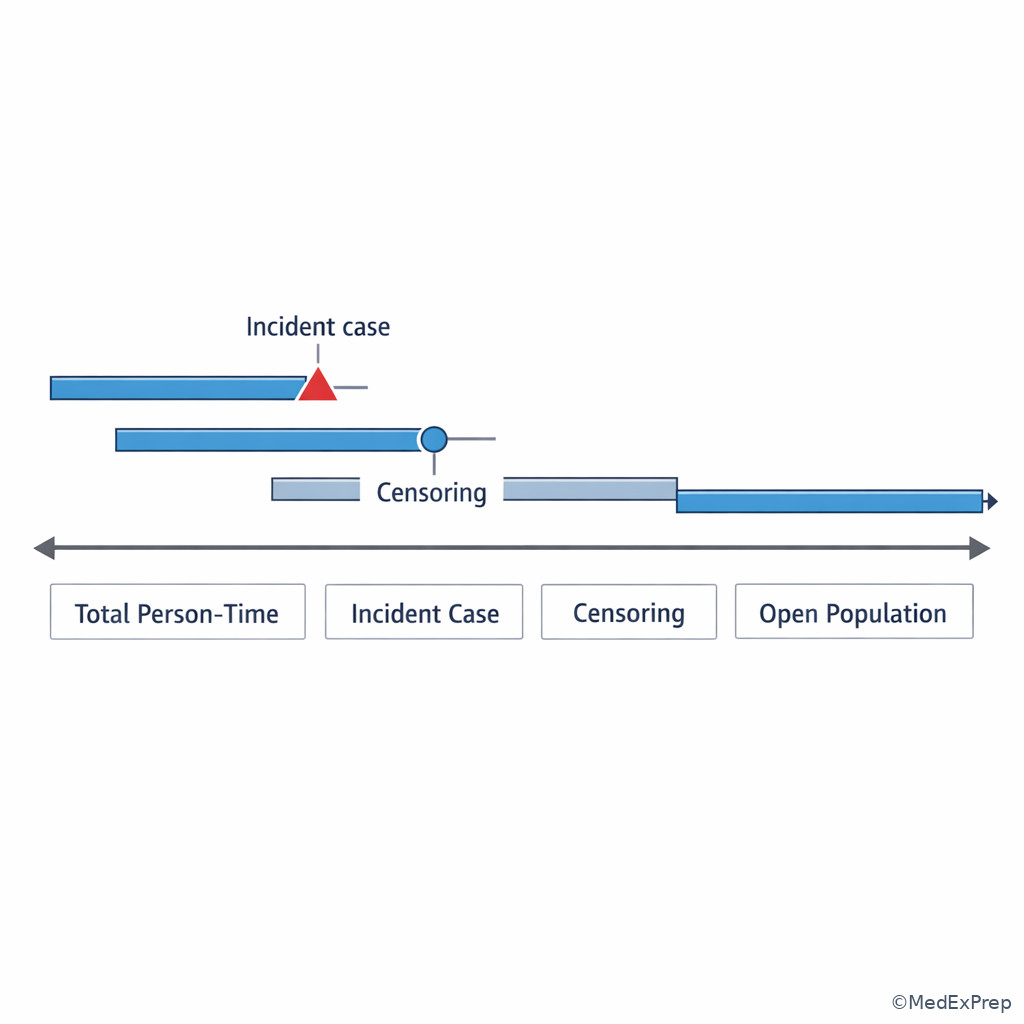
- Person-time is preferred when follow-up time differs across participants.
- Period prevalence can include people who recovered during the interval if they had disease at any point in that period.
- On exams, wording such as “currently,” “at the start of 2026,” or “on June 1” suggests point prevalence; “during 2025” suggests period prevalence; “developed,” “newly diagnosed,” or “became ill” suggests incidence.
| Measure | Numerator | Denominator | Best use |
|---|---|---|---|
| Incidence proportion | New cases during period | Initially disease-free population at risk at start | Risk over a defined interval |
| Incidence rate | New cases | Total person-time at risk | Dynamic populations, unequal follow-up |
| Point prevalence | Existing cases at a point in time | Total population at same point | Current burden |
| Period prevalence | Anyone with disease during interval | Average or mid-period population | Burden across a time interval |
Exam takeaway: Match “new cases/risk” to incidence and “existing burden/current cases” to prevalence.
flowchart TD
A[Read the stem] --> B{What is being counted?}
B -->|Newly developed cases| C[Incidence]
B -->|Existing cases now or during interval| D[Prevalence]
C --> E{Equal follow-up?}
E -->|Yes| F[Incidence proportion]
E -->|No or open population| G[Incidence rate]
D --> H{Single time point or interval?}
H -->|Single time point| I[Point prevalence]
H -->|Interval| J[Period prevalence]
See Fig 1 for the quickest exam-day sorting rule.
Core content
1.1.1.3 Foundational distinction: risk versus burden
A Explanation
The first board-level decision conflict is simple but heavily tested: Are you being asked about new occurrence or total burden? If the stem asks how often disease is developing among people who are initially disease-free, choose incidence. If the stem asks how much disease exists in a population at a given time or during a defined interval, choose prevalence. The single finding that resolves the conflict is the presence of words that imply new onset versus existing cases.
WHY THIS IS TESTED: Many stems include both a time period and existing disease counts, making prevalence look tempting even when the real task is to estimate risk. The board wants you to choose the measure that answers the public health question being asked, not merely the one with a familiar formula.
Use choose-versus-reject framing:
- Choose incidence when comparing risk across exposed and unexposed groups, evaluating preventive interventions, or estimating probability of developing disease.
- Reject prevalence in those settings because prevalence is influenced by both new case occurrence and disease duration.
- Choose prevalence when planning clinic capacity, medication stock, disability services, or current screening workload.
- Reject incidence when the question asks about current burden rather than new onset.
The core formulas are:
\[ \text{Incidence proportion} = \frac{\text{new cases during a period}}{\text{population at risk at start of period}} \]
\[ \text{Point prevalence} = \frac{\text{existing cases at a point in time}}{\text{total population at that point}} \]
Key rule: Incidence tracks transition from non-diseased to diseased. Prevalence takes a snapshot or interval view of how much disease is present.
Clinician Action: Diagnose the metric type by spotting “new cases,” “currently has,” or “during the year.” Order no additional test until the measure is classified correctly. Treat the problem as a denominator-selection task before calculating. Refer/Escalate to data or surveillance specialists if population definitions are unclear in a real program setting.
B Worked example
A 54-year-old man in an employer-sponsored hypertension program has obesity and type 2 diabetes. A preventive medicine physician reviews a roster of 1,000 workers on January 1. At baseline, 220 already have diagnosed hypertension. By December 31, 60 additional workers are newly diagnosed. The company also notes that 40 workers left during the year for retirement. The stem asks for the best estimate of risk of developing hypertension during the year.
Reasoning chain: Identify task -> this is asking about risk of developing disease, so incidence is needed. Extract key facts -> 60 new cases; denominator is those at risk at baseline, not the full 1,000 and not the 220 already diseased. Apply rule -> incidence proportion \(= 60 / 780\). Eliminate distractors -> using 1,000 would be tempting but wrong because baseline cases were not at risk of becoming incident cases. Using 280 would be prevalence-like reasoning. Verify -> the answer reflects new onset over a year in an initially disease-free group.
C Exam trap
Common wrong answer: Use the total population in the denominator for incidence proportion.
WHY IT IS TEMPTING: The stem often presents the total cohort first, and test-takers reflexively divide by that number.
The SINGLE CLUE that eliminates it: People who already had the disease at baseline cannot become new cases of that same disease during follow-up, so they must be removed from the incidence denominator.
D Checkpoint
A health department report states that 18% of adults in County A had diagnosed asthma on July 1, 2025. Which measure is being reported?
- Incidence proportion - Tempting because a percentage is reported, but wrong because there is no new-case time interval from baseline.
- Incidence rate - Tempting because surveillance often tracks rates, but wrong because no person-time denominator is used.
- Point prevalence - Correct because the report counts existing diagnosed asthma at a single point in time, July 1, 2025.
- Period prevalence - Tempting because a date appears in the stem, but wrong because an interval such as “during 2025” is not given.
1.1.1.4 Denominator logic and time structure
A Explanation
The next decision conflict is not incidence versus prevalence; it is which form of incidence or prevalence fits the population structure? Choose cumulative incidence when membership is stable and follow-up is reasonably uniform. Choose incidence rate when the population is open, people contribute different lengths of observation, or the stem provides person-months or person-years. For prevalence, choose point prevalence for a snapshot and period prevalence when anyone with disease during an interval counts.
WHY THIS IS TESTED: ABPM-style stems frequently embed workforce turnover, migration, partial follow-up, or staggered entry because those details test whether you understand the denominator rather than memorized formulas.
The single rule that resolves the conflict is: match the denominator to the time each person is actually at risk. If time at risk differs, person-time is the cleanest denominator. The formula is:
\[ \text{Incidence rate} = \frac{\text{new cases}}{\text{total person-time at risk}} \]
Person-time ends when a participant develops the disease, is lost to follow-up, dies from another cause, or the study period ends. For incidence, a person contributes time only while at risk. For prevalence, in contrast, you are not accumulating time at risk; you are quantifying disease presence in a population at a point or over an interval.
A second frequent pitfall involves the population at risk. Not everyone belongs in the denominator. If the disease cannot occur in a subgroup, that subgroup must be excluded. For example, prevalence of cervical cancer may be reported in women, but incidence among people at risk should exclude those who no longer have a cervix if the stem defines risk that way.
Memory anchor: \(NEW = Narrow to those at risk\). If cases are new, narrow the denominator. \(NOW = whole population now\). If cases exist now, use the whole current population for prevalence.
Recall: This is the first topic in the course, so there is no earlier content to retrieve. Use this section as your base framework; the next lesson on Attack Rate Concepts will narrow denominator logic further to outbreak settings and susceptible contacts.
Clinician Action: Diagnose whether the population is closed or open. Order person-time accounting when members enter or leave the population. Treat the calculation as invalid until baseline cases and non-eligible individuals are excluded. Refer/Escalate to registry or surveillance data managers when time-at-risk definitions differ across reporting systems.
B Worked example
A 32-year-old female resident physician with migraine and mild asthma is included in a tuberculosis screening registry at a teaching hospital. During a 2-year follow-up period, workers start and leave employment at different times. Ten new latent TB infections occur over 2,400 employee-months of observation. The hospital cafeteria also had a norovirus outbreak that month, a distracting fact unrelated to the metric requested. The stem asks for the most appropriate disease frequency measure.
Reasoning chain: Identify task -> dynamic population, unequal follow-up, new cases. Extract key facts -> 10 new cases and 2,400 employee-months. Apply rule -> incidence rate is the correct measure because person-time is given. Eliminate distractors -> cumulative incidence would require a stable baseline denominator; point prevalence ignores new case timing; attack rate is tempting because of the outbreak detail, but that applies to a short outbreak-specific risk period, not this occupational registry scenario. Verify -> the numerator and denominator align as new cases per unit time at risk.
C Exam trap
Common wrong answer: Cumulative incidence in an open population.
WHY IT IS TEMPTING: Learners see “10 new cases over 2 years” and default to any incidence formula.
The SINGLE CLUE that eliminates it: The denominator is person-time, which signals differing observation time across participants and therefore incidence rate.
D Checkpoint
Which situation most strongly indicates that incidence rate is preferred over cumulative incidence?
- A fixed class of 120 students followed for one semester with complete follow-up - Tempting because time is present, but wrong because follow-up is uniform and the cohort is closed.
- A workforce with staggered hiring and resignation dates tracked for needle-stick injuries - Correct because members contribute unequal amounts of time at risk, so person-time is the proper denominator.
- A clinic survey asking how many adults currently have depression - Tempting because it measures disease frequency, but wrong because that is prevalence, not incidence.
- A one-day school outbreak where all cafeteria attendees are counted - Tempting because a short time period appears, but outbreak-specific attack rate is the better concept there.
- The denominator for incidence proportion excludes people who already have the disease at baseline.
- True or False: Person-time is most useful when all participants are observed for the same length of time. False.
- Name the 2 prevalence types: point prevalence and period prevalence.
1.1.1.5 How incidence and prevalence relate through duration and survival
A Explanation
A classic integration trap asks you to explain why prevalence changes even when incidence does not. The decision conflict is whether a change in disease burden reflects more new cases or longer survival/longer duration. The single rule that resolves it is this approximate relationship in a stable population with low prevalence:
\[ \text{Prevalence} \approx \text{Incidence} \times \text{Duration} \]
This is not a universal identity, but it is extremely useful for exam reasoning. If treatment improves survival without curing the disease, prevalence may rise because people live longer with the condition. If a disease becomes rapidly fatal or quickly curable, prevalence may fall even if incidence is unchanged. This is why prevalence is not the best measure for causal studies or intervention efficacy when disease duration changes.
Choose incidence when you need to know whether exposure control reduced new onset. Reject prevalence if the intervention mostly changes survival or recovery time. Choose prevalence when you need to estimate service burden, especially for chronic diseases such as diabetes, osteoarthritis, or HIV.
One of the most board-relevant contrasts: common cold tends to have high incidence and low prevalence because episodes are frequent but brief. Diabetes may have lower incidence than colds but much higher prevalence because duration is long. Preventive physicians use this distinction to align metrics with planning versus causal inference.
High-Yield Connection: This concept is tested alongside Mortality and Fatality Measures. Know both why survival changes prevalence and why mortality measures can remain unchanged or change differently for exam day; these are frequently paired in stems.
Memory anchor: “Prevalence parks disease; incidence ignites disease.” Parking depends on how many arrive and how long they stay.
Clinician Action: Diagnose whether a prevalence increase represents rising incidence, longer survival, or broader case finding. Order incident-case data before concluding that prevention failed. Treat prevalence as a burden metric for staffing and chronic disease management. Refer/Escalate to disease surveillance or program evaluation teams if outcome definitions changed over time.
B Worked example
A county HIV program notes that the prevalence of people living with HIV increased over 5 years after implementation of improved antiretroviral treatment access. A 47-year-old man with controlled hypertension and chronic hepatitis B is one of many patients now living longer in care. Annual numbers of newly diagnosed HIV infections remained stable. A policymaker argues that prevention programs must be failing because prevalence increased. Which interpretation is most accurate?
Reasoning chain: Identify task -> explain a prevalence increase. Extract key facts -> incidence stable; survival improved; chronic disease duration increased. Apply rule -> prevalence can rise when duration increases even if incidence is unchanged. Eliminate distractors -> a claim of worsening transmission is tempting because more people are living with disease, but the stem explicitly says new diagnoses are stable. Verify -> the increase reflects greater survival and longer duration of disease in the population.
C Exam trap
Common wrong answer: “Higher prevalence proves higher incidence.”
WHY IT IS TEMPTING: More disease in the population feels like more new cases must be occurring.
The SINGLE CLUE that eliminates it: If survival improves or disease duration lengthens, prevalence can increase even when incidence stays stable.
D Checkpoint
A new therapy for a chronic neurologic disease reduces mortality but does not reduce the rate of new diagnoses. Which effect is most likely over the next several years?
- Incidence decreases and prevalence decreases - Tempting because treatment sounds beneficial, but wrong because treatment does not reduce new diagnoses.
- Incidence stays stable and prevalence increases - Correct because people live longer with the disease, increasing duration and therefore burden.
- Incidence increases and prevalence stays stable - Tempting if more people are counted, but wrong because the stem states the rate of new diagnoses does not change.
- Incidence decreases and prevalence increases - Tempting because both can move differently, but wrong because there is no evidence that new-case occurrence fell.
1.1.1.6 Using the right measure for surveillance, screening, and program decisions
A Explanation
The final foundational-to-applied step is knowing which metric best answers a practical preventive medicine question. The decision conflict is often between etiology/program effectiveness and service burden/resource planning. The single rule that resolves it: choose incidence for risk, prevention evaluation, and causal questions; choose prevalence for current workload, chronic disease burden, and resource allocation.
WHY THIS IS TESTED: The board exam does not stop at formula recognition. It asks which metric a preventive medicine physician should use to plan a clinic, compare risk between exposed groups, design screening outreach, or interpret surveillance data.
Examples:
- Incidence for evaluating whether a smoking cessation program reduced new COPD diagnoses.
- Incidence for comparing infection risk across occupational exposure categories.
- Prevalence for estimating how many people currently need diabetes management visits.
- Prevalence for planning mental health staffing in a workplace or community.
Be careful with screening language. Screening programs often use prevalence to estimate how many existing undiagnosed cases may be found at baseline, but incidence becomes more useful when evaluating whether prevention reduced future disease occurrence. If the question asks “how many people currently have the condition?” think prevalence. If it asks “how many people develop it over time?” think incidence.
High-Yield Connection: This concept overlaps with Screening Program Principles and Surveillance System Design. Know both which measure describes current detectable burden and which measure evaluates future prevention effect; they are commonly contrasted in stems.
Clinician Action: Diagnose the operational question: risk reduction or current burden. Order incident-case tracking when evaluating preventive programs and prevalent-case counts when planning services. Treat mismatched metrics as a design flaw in program evaluation. Refer/Escalate to epidemiology support if surveillance definitions are inconsistent across jurisdictions; requirements and local protocols vary.
B Worked example
A 61-year-old woman with obesity, osteoarthritis, and treated depression lives in a county considering a new diabetes prevention initiative. The health department director asks which metric is most appropriate to assess whether the initiative lowers the risk of developing diabetes over the next 3 years. A consultant presents current county diabetes prevalence, and another presents the number of endocrinology visits, both tempting but incomplete data points.
Reasoning chain: Identify task -> evaluate whether risk of new disease falls after an intervention. Extract key facts -> the question is about developing diabetes over time, not how many currently have it. Apply rule -> incidence is the correct outcome measure. Eliminate distractors -> prevalence and clinic visits measure burden and resource use, not new onset. Verify -> incidence best reflects prevention effect.
C Exam trap
Common wrong answer: Use prevalence to evaluate prevention effectiveness.
WHY IT IS TEMPTING: Prevalence is easier to measure and often available in public reports.
The SINGLE CLUE that eliminates it: If the question asks whether an intervention changed the chance of developing disease, the target construct is new onset, so incidence is required.
D Checkpoint
A community clinic wants to estimate how many clinicians are needed next month for patients currently living with chronic hepatitis C. Which measure best answers that question?
- Cumulative incidence - Tempting because it captures disease frequency, but wrong because the clinic needs current burden, not new risk.
- Incidence rate - Tempting in a dynamic population, but wrong because the planning question is about current existing cases.
- Point prevalence - Correct because staffing needs depend on how many people currently have the disease.
- Secondary attack rate - Tempting if thinking about transmission, but wrong because there is no outbreak or susceptible contact network in this question.
- The most useful measure for evaluating whether a prevention program reduced disease onset is incidence.
- True or False: Prevalence is usually preferred for clinic staffing decisions. True.
- Name one reason prevalence may increase without higher incidence: longer disease duration or improved survival.
1.1.1.7 Calculation patterns and board-style interpretation
A Explanation
When the exam moves from verbal distinction to arithmetic, the decision conflict becomes: Which numbers belong in the formula, and what does the result mean? The single rule is to build the measure from a numerator that exactly matches the event definition and a denominator that exactly matches the population/time at risk.
Calculation steps:
- Identify whether the stem asks for incidence proportion, incidence rate, point prevalence, or period prevalence.
- Mark who qualifies for the numerator.
- Mark who qualifies for the denominator.
- Check whether baseline cases should be excluded.
- Check whether follow-up time varies.
- Interpret the result in words, not just numbers.
Example interpretations:
- Incidence proportion of 5% over 1 year means 5 out of every 100 initially disease-free people developed the condition over that year.
- Incidence rate of 4 per 1,000 person-years means 4 new cases occurred for every 1,000 years of observation among people at risk.
- Point prevalence of 12% means 12% of the population had the disease at that time.
Board stems may include irrelevant details such as comorbidities, other conditions, or counts of hospital visits. Those data do not belong in the formula unless they define case status or time at risk.
Exam takeaway: Correct answers pair the right numerator and denominator before translating the result into words.
flowchart LR
A[New cases] --> B[Incidence]
B --> C[Population at risk at start]
B --> D[Person-time at risk]
E[Existing cases] --> F[Prevalence]
F --> G[Total population now]
F --> H[Population during interval]
C --> I[Risk over interval]
D --> J[Rate in dynamic population]
G --> K[Current burden]
H --> L[Burden during period]
See Fig 2 when you need to translate equations into plain-language meaning.
Common pitfall: Reporting an incidence calculation as if it were current burden, or reporting prevalence as if it were risk. The board often tests this through interpretation wording rather than arithmetic alone.
Clinician Action: Diagnose errors by asking whether the reported denominator truly represents the at-risk group. Order re-analysis when baseline cases or person-time were mishandled. Treat every calculation as incomplete until it is translated into public health meaning. Refer/Escalate to analytic support when measures are being compared across systems with different case definitions.
B Worked example
A school district tracks physician-diagnosed influenza among 2,000 students on a single day in January and finds 100 students currently ill. Later, over the next 10 weeks, 240 students newly develop influenza. A 14-year-old boy with asthma and ADHD is among the current cases, a distracting clinical detail. The exam asks which result describes current burden on the survey day.
Reasoning chain: Identify task -> current burden on one day means point prevalence. Extract key facts -> 100 currently ill out of 2,000 students. Apply rule -> point prevalence \(= 100/2000 = 5\%\). Eliminate distractors -> 240 new cases over 10 weeks is incidence information, not the answer to a one-day burden question. Verify -> the interpretation is that 5% of students were ill on the survey day.
C Exam trap
Common wrong answer: Use the larger number of new cases because it feels more informative.
WHY IT IS TEMPTING: Learners may prioritize the more dramatic number instead of matching the stem’s question.
The SINGLE CLUE that eliminates it: The words “currently ill” and “on a single day” define point prevalence, not incident disease over follow-up.
D Checkpoint
In a cohort of 500 initially disease-free workers, 25 develop dermatitis over 1 year. Which interpretation is best?
- The point prevalence of dermatitis is 5% at 1 year - Tempting because 25/500 = 5%, but wrong because the stem describes new cases over a follow-up interval.
- The cumulative incidence of dermatitis is 5% over 1 year - Correct because 25 new cases occurred among 500 initially disease-free workers over a specified interval.
- The incidence rate of dermatitis is 5 per 100 person-years - Tempting because the numbers seem similar, but wrong because person-time was not provided.
- The period prevalence of dermatitis is 5% during the year - Tempting because a year-long interval is given, but wrong because only new cases, not all who had dermatitis during the year, are described.
1.1.1.8 Integration with upcoming outbreak and mortality measures
A Explanation
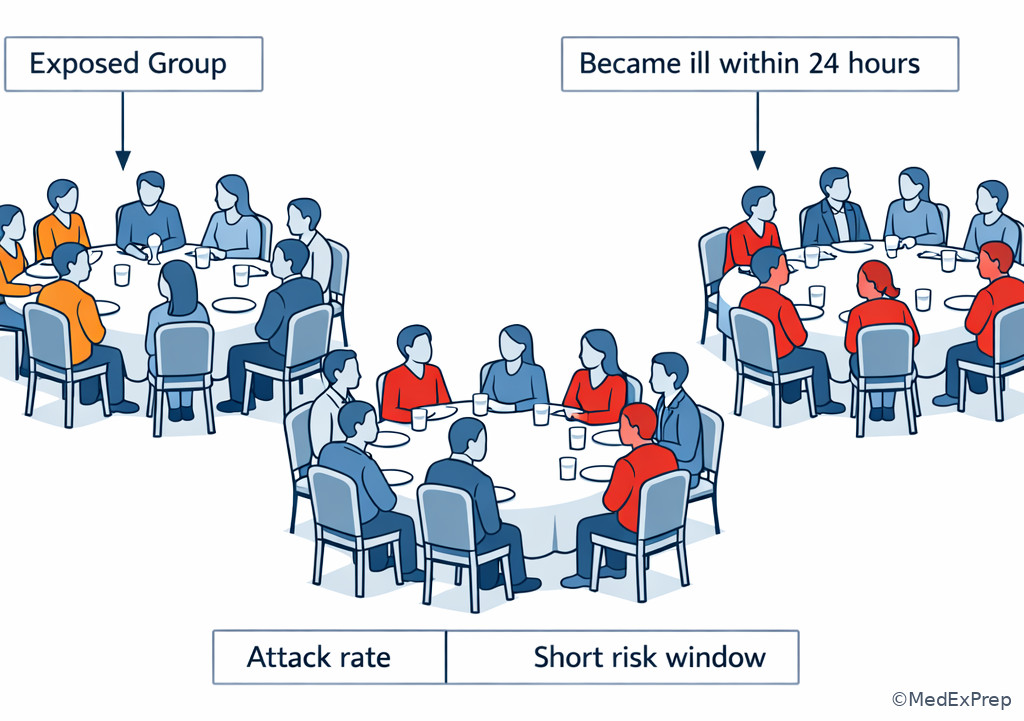
The last step is recognizing where incidence and prevalence stop and where neighboring measures begin. The decision conflict is often between general incidence, attack rate, and mortality/fatality measures. The single rule: incidence and prevalence are disease frequency measures; attack rate is a special outbreak-oriented form of incidence proportion; mortality and case-fatality focus on death, not merely disease occurrence.
WHY THIS IS TESTED: Board stems often present an outbreak or death data in a way that tempts you to answer with incidence or prevalence. Correct reasoning requires reading the event being counted: illness, existing illness, death in the population, or death among cases.
Forward links:
- Attack rate Concepts: use when there is a short outbreak window and a clearly exposed group. Denominator selection becomes even more specific, especially for secondary attack rate among susceptible contacts.
- Mortality and Fatality Measures: use when the numerator is death rather than disease presence or new diagnosis.
For this lesson, your job is not to master those topics fully but to know when incidence and prevalence are not enough. If the stem asks about “proportion of exposed wedding guests who became ill,” think attack rate, not general prevalence. If it asks “deaths due to disease per population,” think mortality; if it asks “deaths among people with the disease,” think case-fatality.
Exam takeaway: Read the event in the numerator first to separate disease occurrence, outbreak spread, and death-based measures.
flowchart TD
A[Disease frequency question] --> B{What is the event?}
B -->|New disease| C[Incidence]
B -->|Existing disease| D[Prevalence]
B -->|New disease in outbreak exposure window| E[Attack rate]
B -->|Deaths in population| F[Mortality rate]
B -->|Deaths among cases| G[Case-fatality ratio]
See Fig 3 to prevent cross-topic mix-ups as the course expands.
Clinician Action: Diagnose whether the problem is general disease frequency, outbreak spread, or death outcome. Order the appropriate numerator definition before calculating. Treat ambiguous denominator definitions as a reason to pause interpretation. Refer/Escalate to local public health guidance or outbreak protocol when event definitions vary by jurisdiction; confirm current requirements with the relevant authority.
B Worked example
A 38-year-old food service worker with seasonal allergies and hyperlipidemia attends a catered conference. Forty of 100 attendees develop vomiting and diarrhea within 24 hours. Two days later, a county dashboard reports that 1.2% of county residents currently have norovirus-like illness. The stem asks for the best measure of disease frequency among conference attendees during the outbreak.
Reasoning chain: Identify task -> outbreak among a defined exposed group over a short period. Extract key facts -> 40 of 100 attendees became ill after the event. Apply rule -> this is an attack rate, a specialized form of incidence proportion. Eliminate distractors -> county prevalence is tempting because it is reported as a percentage, but it describes current community burden, not outbreak risk among attendees. Verify -> the appropriate measure is attack rate, previewing the next lesson.
C Exam trap
Common wrong answer: Prevalence in an outbreak stem.
WHY IT IS TEMPTING: The stem gives a proportion of ill people and may not explicitly say “attack rate.”
The SINGLE CLUE that eliminates it: A short outbreak period within a defined exposed group points to attack rate, not prevalence.
D Checkpoint
Which wording most strongly suggests that a later topic’s mortality measure, rather than incidence or prevalence, will be required?
- “Number of adults newly diagnosed with COPD this year” - Tempting because it is a rate-like statement, but it still concerns new disease occurrence, so incidence is the domain.
- “Percentage of residents currently living with COPD” - Tempting because it is population-based, but it measures existing disease burden, so prevalence is the domain.
- “Number of deaths due to COPD per 100,000 residents this year” - Correct because the numerator is death in the population, which defines mortality.
- “Percentage of clinic patients who had COPD at any time this year” - Tempting because it spans a time interval, but it still measures period prevalence, not death.
Exam Traps & Differentiators
Common traps & distractors: These items are designed to look close. Use the single discriminator, not overall familiarity.
1.1.1.9 Most common wrong answer and why
The most common wrong answer is choosing prevalence when the stem actually asks about risk of developing disease. This is tempting because prevalence is more intuitive and often more available in public reports. The fix is to ask: “Does the stem care about new onset?” If yes, prevalence is wrong even if the reported burden is high.
1.1.1.10 Looks similar but isn't
| Confusable pair | Why they look similar | Single clue that separates them | Best use |
|---|---|---|---|
| Incidence proportion vs point prevalence | Both can be expressed as percentages | Incidence uses new cases over follow-up; point prevalence uses existing cases at one time | Risk vs current burden |
| Incidence proportion vs incidence rate | Both count new cases | Incidence rate uses person-time | Closed cohort vs variable follow-up |
| Period prevalence vs cumulative incidence | Both involve a time interval | Period prevalence includes anyone with disease during the interval, not just newly affected people | Burden over interval vs risk over interval |
| Incidence vs attack rate | Both involve new cases | Attack rate is outbreak-specific with a short risk window and defined exposed group | Outbreak analysis |
| Prevalence vs mortality | Both may use population denominators | Mortality counts deaths, not living cases | Death outcomes |
1.1.1.11 If the stem says ___, think ___
- If the stem says “newly diagnosed,” “developed,” “became ill,” think incidence.
- If the stem says “currently has,” “on June 1,” “at baseline survey,” think point prevalence.
- If the stem says “during 2025” and counts anyone with the disease during that interval, think period prevalence.
- If the stem says “person-years,” “person-months,” “staggered entry,” think incidence rate.
- If the stem says “outbreak,” “wedding attendees,” “household contacts,” think attack rate concepts rather than general prevalence.
- If the stem says “deaths due to” or “deaths among those with disease,” think mortality/fatality measures.
Exam takeaway: A timeline view makes clear that incidence counts new entries into disease while prevalence counts everyone currently in the disease state.
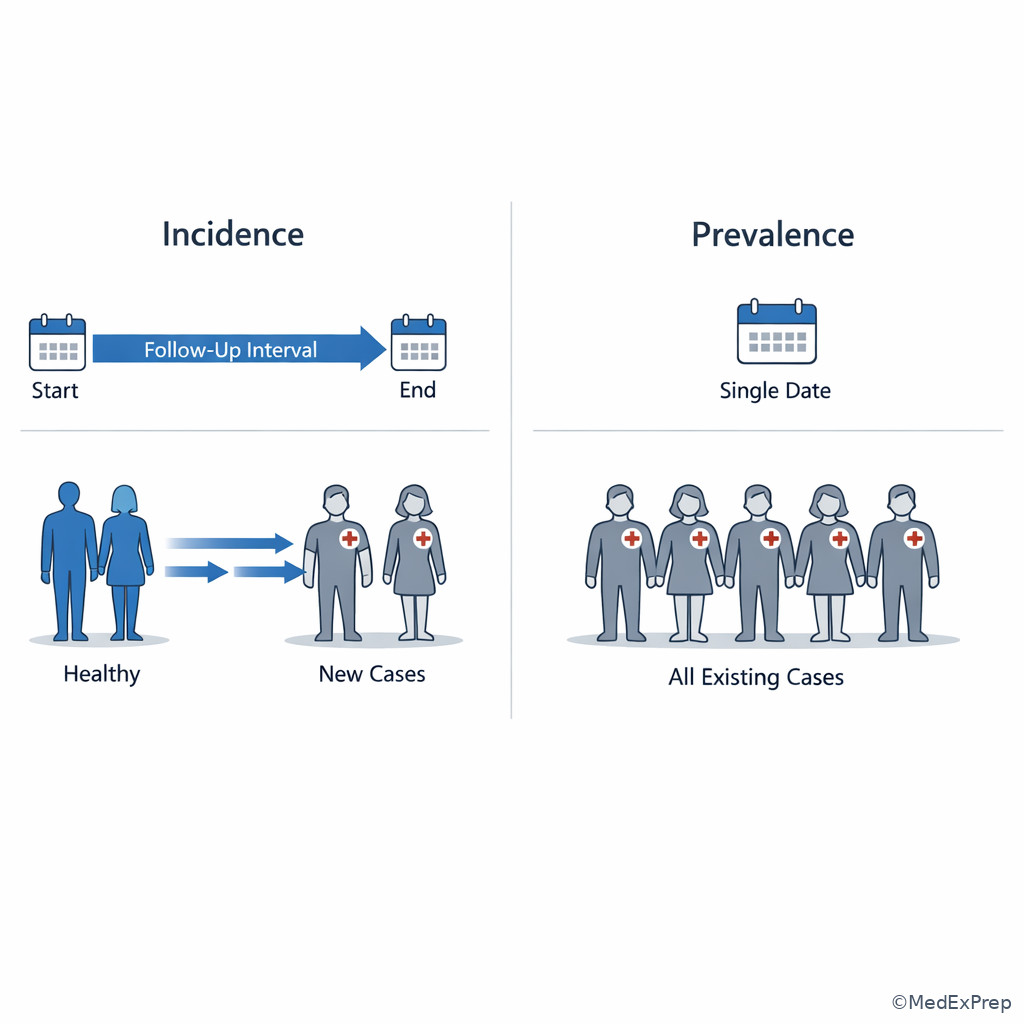
See Fig 4 when you need a mental picture rather than a formula.
Exam takeaway: Longer survival or slower recovery can increase prevalence even when incidence is unchanged.
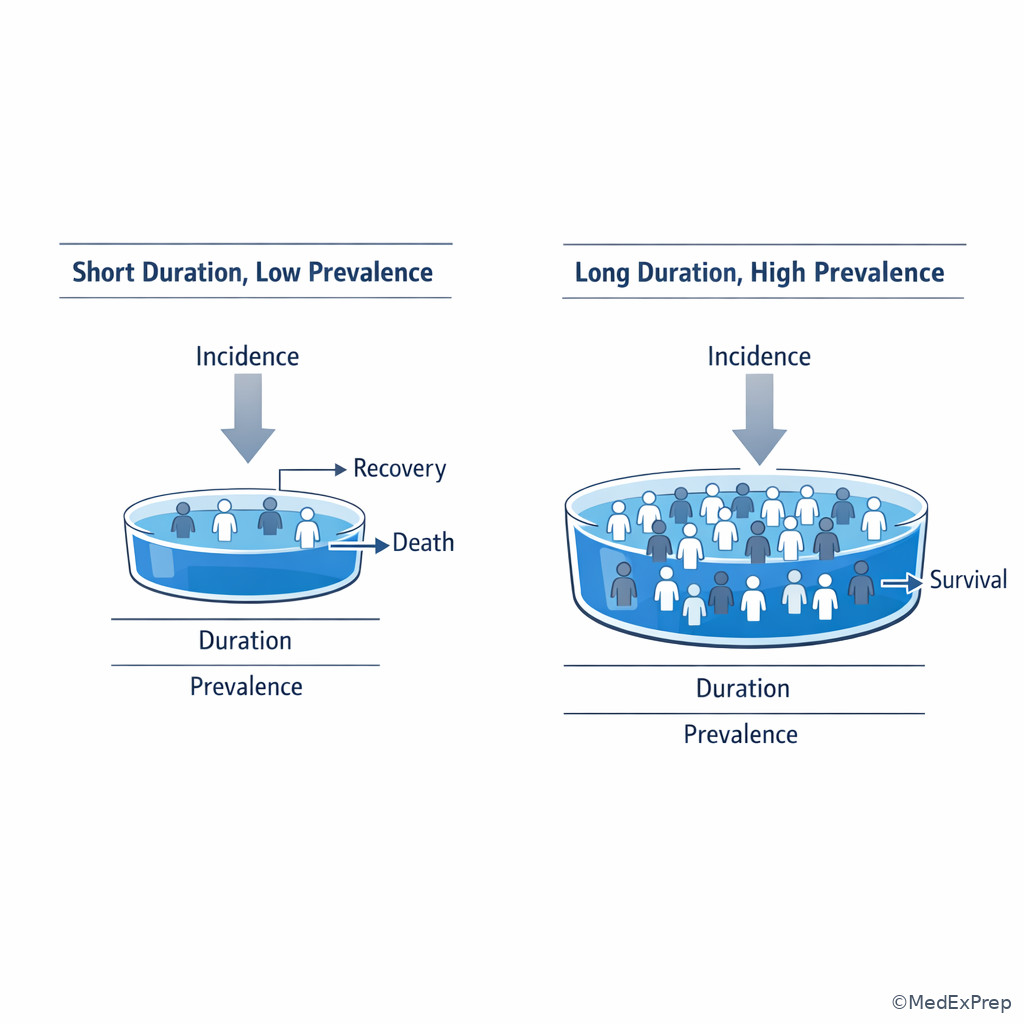
See Fig 5 for the survival-duration trap.
Exam takeaway: Exclude baseline cases and non-eligible people before calculating incidence.
Exam takeaway: Incidence rate is preferred when entry, exit, and follow-up length vary across participants.
Exam takeaway: Point prevalence is a snapshot, whereas period prevalence includes anyone diseased at any time in the interval.
Exam takeaway: In a defined exposed group over a short outbreak window, attack rate replaces general prevalence logic.
Tables
| Key fact/value | High-yield point |
|---|---|
| Incidence numerator | New cases only |
| Incidence denominator | Population at risk or person-time at risk |
| Prevalence numerator | Existing cases |
| Point prevalence timing | Single date or moment |
| Period prevalence timing | Specified interval |
| Best measure for risk | Incidence |
| Best measure for current burden | Prevalence |
| Effect of longer duration on prevalence | Usually increases it |
| Effect of improved survival on prevalence | Usually increases it if disease persists |
| Feature | Incidence proportion | Incidence rate | Prevalence |
|---|---|---|---|
| Counts new cases? | Yes | Yes | No, counts existing cases |
| Uses person-time? | No | Yes | No |
| Best for closed cohort? | Yes | Can be used | Not the main purpose |
| Best for open population? | Less ideal | Yes | Yes for burden snapshot |
| Answers risk question? | Yes | Yes, as rate of occurrence | No |
| Answers burden question? | Indirectly at best | Indirectly at best | Yes |
| Stem wording pattern | Likely measure | Why |
|---|---|---|
| “Currently has disease” | Point prevalence | Single-time burden snapshot |
| “Had disease at any time during the year” | Period prevalence | Counts anyone affected during interval |
| “Developed disease over 12 months” | Cumulative incidence | New onset over defined follow-up |
| “10 cases per 5,000 person-years” | Incidence rate | Person-time denominator |
| “Became ill after attending wedding banquet” | Attack rate | Outbreak-specific incidence proportion |
| “Deaths due to disease per population” | Mortality rate | Death, not disease occurrence |
Algorithm / Approach
Exam takeaway: A stepwise read of event, time frame, and denominator prevents nearly all first-topic epidemiology errors.
flowchart TD
A[Start with stem wording] --> B{What is counted?}
B -->|New cases| C{Follow-up structure?}
B -->|Existing cases| D{Time format?}
B -->|Death| E[Go to mortality/fatality measures]
B -->|Outbreak illness in defined exposure group| F[Go to attack rate concepts]
C -->|Fixed cohort, same follow-up| G[Cumulative incidence]
C -->|Open cohort or unequal follow-up| H[Incidence rate]
D -->|Single date| I[Point prevalence]
D -->|Interval| J[Period prevalence]
G --> K[Interpret as risk]
H --> L[Interpret as rate]
I --> M[Interpret as current burden]
J --> N[Interpret as interval burden]
See Fig 6 as your global decision tree for this chapter opening topic.
Rapid Review
- Incidence → new onset among those initially disease-free
- Prevalence → all existing disease in the population
- Point prevalence → one date, one snapshot
- Period prevalence → anyone diseased during the interval
- Incidence rate → new cases per person-time
- Cumulative incidence → risk in a closed cohort over a stated period
- Population at risk → exclude baseline cases and biologically ineligible persons
- High prevalence + low incidence → think long duration chronic disease
- High incidence + low prevalence → think short-duration or rapidly fatal disease
- Program effectiveness for prevention → incidence beats prevalence
- Clinic staffing and chronic care planning → prevalence beats incidence
- Improved survival without cure → prevalence rises even if incidence does not
- Person-years in denominator → incidence rate, not cumulative incidence
- Short outbreak in exposed group → attack rate preview, not routine prevalence
Memory anchor: \(I = Inflow\) of new cases; \(P = Pool\) of all cases present. If the question is about entries, use incidence. If it is about pool size, use prevalence.
Self-check quiz
1.1.1.12 Question 1
A 46-year-old woman with obesity and hypothyroidism is included in a county survey conducted on March 1, 2026. The report states that 14% of adults had diagnosed migraine on that date. Which is the most appropriate interpretation?
- Incidence proportion of migraine
- Incidence rate of migraine
- Point prevalence of migraine
- Period prevalence of migraine
1.1.1.13 Question 2
A preventive medicine physician follows 800 initially disease-free workers for 1 year. Forty workers develop new carpal tunnel syndrome. Which measure is most appropriate?
- Point prevalence
- Cumulative incidence
- Period prevalence
- Case-fatality ratio
1.1.1.14 Question 3
A 57-year-old man with hypertension and obesity is part of a county diabetes prevention program. The health department wants the best measure to determine whether the program reduced the risk of developing diabetes over 3 years. Current diabetes clinic volume is also available but is not the target outcome. Which is the most appropriate measure?
- Point prevalence of diabetes
- Period prevalence of diabetes
- Incidence of diabetes
- Current number of diabetes visits
1.1.1.15 Question 4
A 29-year-old nurse with asthma and allergic rhinitis works in a hospital where employees are hired throughout the year and some leave before year-end. The occupational health service tracks 12 new needlestick injuries over 4,800 worker-months. Which is the most appropriate disease frequency measure?
- Point prevalence
- Cumulative incidence
- Incidence rate
- Period prevalence
1.1.1.16 Question 5
A 63-year-old man with HIV, well-controlled hypertension, and chronic kidney disease lives in a county that expanded access to effective antiretroviral therapy. Five years later, the prevalence of people living with HIV has increased, but the annual number of new diagnoses is unchanged. Which interpretation is most appropriate?
- Incidence increased substantially
- Prevalence increased because disease duration increased
- Screening must have become less sensitive
- The population denominator must have decreased
1.1.1.17 Question 6
A 51-year-old woman with depression and obesity is part of a workplace cohort of 1,200 employees. At baseline, 180 already have diagnosed hypertension. Over 2 years, 60 additional employees are newly diagnosed. Twenty employees leave employment after 6 months, and 30 are hired at month 12. The question asks for the most appropriate estimate of the risk of developing hypertension over 2 years in the original disease-free cohort. Which is the best answer?
- 60/1,200
- 60/1,020
- 60 divided by total person-time
- 240/1,200
1.1.1.18 Question 7
A 34-year-old man with seasonal allergies and gastroesophageal reflux attends a wedding. Within 18 hours, 45 of 90 attendees develop vomiting and diarrhea. A county dashboard on the same day shows that 0.8% of county residents currently have acute gastroenteritis. Which measure best describes disease frequency among wedding attendees?
- Point prevalence
- Cumulative incidence
- Attack rate
- Incidence rate
1.1.1.19 Question 8
A 68-year-old woman with diabetes and osteoarthritis asks why a chronic neurologic disease appears “more common now” in public reports. A preventive medicine physician reviews state data showing stable annual incidence over a decade, earlier diagnosis through improved detection, and lower disease-specific mortality due to better treatment. Which single factor most directly explains a higher prevalence despite stable incidence?
- Shorter disease duration
- Longer survival with disease
- Lower baseline population size alone
- Reduced case ascertainment
Answer key
1.1.1.20 Question 1 answer: C. Point prevalence
Why C is correct: The mechanism is disease burden at a single time point. “On March 1, 2026” identifies a snapshot, and “had diagnosed migraine” refers to existing cases, not new onset. The discriminating clue is the single date. Source: Gordis, Epidemiology; CDC epidemiology training materials.
- A. Incidence proportion - Tempting because the answer is a percentage, but incorrect because incidence requires new cases among those initially disease-free over a follow-up interval. Discriminator: no new diagnoses over time are described.
- B. Incidence rate - Tempting because public health reports often use rates, but incorrect because there is no person-time denominator. Discriminator: one survey date, not person-time.
- C. Point prevalence - Correct because it measures existing migraine at a single point in time. Discriminator: “on March 1, 2026.”
- D. Period prevalence - Tempting because prevalence can be over a time interval, but incorrect because no interval such as “during 2026” is given. Discriminator: single date rather than interval.
1.1.1.21 Question 2 answer: B. Cumulative incidence
Why B is correct: The mechanism is new disease occurrence in a closed, initially disease-free cohort followed over a defined interval. That is cumulative incidence. The discriminating clue is “initially disease-free workers” followed for 1 year. Source: Gordis, Epidemiology; Friis and Sellers, Epidemiology for Public Health Practice.
- A. Point prevalence - Tempting because a single year is mentioned, but incorrect because the question concerns new cases over follow-up, not existing cases at a specific time. Discriminator: “develop” indicates incident disease.
- B. Cumulative incidence - Correct because 40 new cases arose among 800 disease-free workers during one year. Discriminator: defined at-risk denominator with new cases.
- C. Period prevalence - Tempting because the interval is one year, but incorrect because period prevalence would include everyone who had carpal tunnel syndrome at any time during the year, including preexisting cases. Discriminator: only new cases are provided.
- D. Case-fatality ratio - Tempting only if one confuses disease occurrence with severe outcome measures, but incorrect because no deaths among cases are described. Discriminator: numerator is not death.
1.1.1.22 Question 3 answer: C. Incidence of diabetes
Why C is correct: The mechanism is evaluating whether a prevention program lowers the chance of developing disease. That requires a new-onset measure, so incidence is the correct metric. The discriminating clue is “reduced the risk of developing diabetes over 3 years.” Source: Gordis, Epidemiology; U.S. Preventive Services Task Force methods concepts on outcome framing.
- A. Point prevalence of diabetes - Tempting because it is often available from routine reports, but incorrect because it reflects current burden and is influenced by duration. Discriminator: the target is future risk reduction.
- B. Period prevalence of diabetes - Tempting because the follow-up lasts 3 years, but incorrect because prevalence does not isolate new disease occurrence. Discriminator: the stem asks about developing disease.
- C. Incidence of diabetes - Correct because it measures new cases during follow-up and best reflects prevention effect. Discriminator: “risk of developing.”
- D. Current number of diabetes visits - Tempting because utilization is easy to count, but incorrect because clinic volume is a service metric, not a disease frequency measure of new onset. Discriminator: visits do not equal incident disease.
1.1.1.23 Question 4 answer: C. Incidence rate
Why C is correct: The mechanism is counting new events in an open population with variable follow-up. Worker-months are person-time, which identifies incidence rate as the correct measure. The discriminating clue is “4,800 worker-months.” Source: Gordis, Epidemiology; CDC field epidemiology training materials.
- A. Point prevalence - Tempting because it is a common workplace surveillance measure, but incorrect because the stem provides new injuries over time, not existing current injuries. Discriminator: new cases plus person-time.
- B. Cumulative incidence - Tempting because new cases are counted, but incorrect because hiring and leaving make follow-up unequal. Discriminator: open population with staggered observation.
- C. Incidence rate - Correct because new injuries are divided by total time at risk. Discriminator: worker-month denominator.
- D. Period prevalence - Tempting because the observation spans a year, but incorrect because period prevalence counts everyone who had the condition during the interval, not new event occurrence per person-time. Discriminator: event-rate framing.
1.1.1.24 Question 5 answer: B. Prevalence increased because disease duration increased
Why B is correct: The mechanism is longer survival with chronic disease, which increases duration and therefore prevalence even if incidence remains unchanged. The discriminating clue is unchanged new diagnoses plus better treatment access. Source: Gordis, Epidemiology; Harrison’s disease epidemiology concepts.
- A. Incidence increased substantially - Tempting because more people are living with HIV, but incorrect because the stem explicitly says annual new diagnoses are unchanged. Discriminator: stable incidence.
- B. Prevalence increased because disease duration increased - Correct because effective therapy prolongs life with disease. Discriminator: improved survival in a chronic condition.
- C. Screening must have become less sensitive - Tempting if one overthinks detection issues, but incorrect because reduced sensitivity would miss cases rather than explain more people living with diagnosed disease. Discriminator: treatment, not test performance, changed.
- D. The population denominator must have decreased - Tempting because denominator shifts can affect proportions, but incorrect because the stem provides a clear mechanism through survival and gives no evidence of denominator shrinkage. Discriminator: explicit survival improvement.
1.1.1.25 Question 6 answer: B. 60/1,020
Why B is correct: The mechanism is cumulative incidence in the original disease-free cohort. Start with 1,200 employees, remove 180 with preexisting hypertension, leaving 1,020 at risk at baseline. The question asks for risk in the original disease-free cohort, not an incidence rate in an open population. The discriminating clue is “most appropriate estimate of the risk ... in the original disease-free cohort.” Source: Gordis, Epidemiology; Friis and Sellers, Epidemiology for Public Health Practice.
- A. 60/1,200 - Tempting because it uses the full cohort size, but incorrect because baseline hypertension cases were not at risk for incident hypertension. Discriminator: 180 already diseased at baseline.
- B. 60/1,020 - Correct because the baseline at-risk population is 1,200 minus 180. Discriminator: original disease-free cohort wording.
- C. 60 divided by total person-time - Tempting because employees enter and leave, but incorrect for this specific question because the stem explicitly asks for risk in the original cohort, not rate in a dynamic population. Discriminator: “risk” and “original disease-free cohort.”
- D. 240/1,200 - Tempting because 240 may look like total hypertension burden, but incorrect because it mixes prevalent and incident cases. Discriminator: incident numerator should be 60, not 240.
1.1.1.26 Question 7 answer: C. Attack rate
Why C is correct: The mechanism is new illness among a defined exposed group over a short outbreak window, which is attack rate, a special form of incidence proportion. The discriminating clue is a wedding-associated illness cluster within 18 hours. Source: CDC outbreak investigation principles; Gordis, Epidemiology.
- A. Point prevalence - Tempting because the county dashboard gives a current percent, but incorrect because the question asks about illness frequency among wedding attendees after a specific exposure. Discriminator: defined exposed group in an outbreak.
- B. Cumulative incidence - Tempting because attack rate is closely related to incidence proportion, but incorrect in the exam’s preferred terminology because this is an outbreak setting. Discriminator: short outbreak after a shared event.
- C. Attack rate - Correct because it measures the proportion of exposed attendees who became ill during the outbreak window. Discriminator: outbreak-specific, exposed cohort.
- D. Incidence rate - Tempting if one thinks any new case measure qualifies, but incorrect because person-time is not the issue in this short outbreak analysis. Discriminator: no person-time denominator.
1.1.1.27 Question 8 answer: B. Longer survival with disease
Why B is correct: The mechanism is increased duration from earlier diagnosis and lower disease-specific mortality. With stable incidence, longer survival increases the number of people living with disease at any time, raising prevalence. The discriminating clue is stable incidence with lower mortality. Source: Gordis, Epidemiology; Harrison’s core population-health concepts.
- A. Shorter disease duration - Tempting if one confuses turnover with burden, but incorrect because shorter duration would generally lower prevalence. Discriminator: better treatment prolongs disease duration, not shortens it.
- B. Longer survival with disease - Correct because it increases duration and therefore prevalence. Discriminator: lower disease-specific mortality.
- C. Lower baseline population size alone - Tempting because denominator changes can alter proportions, but incorrect because the stem gives a direct causal mechanism via survival and detection. Discriminator: explicit mortality improvement.
- D. Reduced case ascertainment - Tempting because detection affects observed prevalence, but incorrect because reduced ascertainment would usually decrease observed prevalence, not increase it. Discriminator: earlier diagnosis means better, not worse, ascertainment.